Data Visualisation Services | Turn Complex Data into Clear Insights
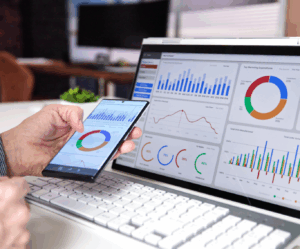
At Express Analytics, we understand that raw data holds immense power, but only when its story can be seen. Our Data Visualisation Services are designed to transform your large, complex datasets into intuitive, interactive dashboards, fostering business clarity and empowering strategic decision-making.
Express Analytics’ Approach
-
Retail & eCommerce
Track Sales Trends Instantly
Leverage intuitive visuals to monitor real-time inventory, seasonal shifts, and customer behavior, thereby driving conversions.
-
Financial Services
Make Risk Visible
Support smarter, faster decision-making by visualizing KPIs, portfolio performance, and fraud indicators across accounts.

-
Healthcare
Spot Care Gaps Clearly
Monitor patient data, resource distribution, and health results using intuitive, compliant dashboards.
-
Marketing & Advertising
Visualize Campaign Impact
Centralized dashboards offer insights into ROAS, engagement, and audience trends across various channels.
-
Enhanced Clarity
Transform complex data into clear, actionable visuals.
-

Faster Decisions
Gain real-time insights to move from analysis to action quickly.
-

Improved Collaboration
Facilitate departmental alignment on key metrics through shared, interactive dashboards.
-
End-to-End Data Visualization Services
End-to-End Data Visualization Services
From strategic planning to dashboard deployment and design.
-
Custom Dashboards for Any Use Case
Custom Dashboards for Any Use Case
Tailored to your KPIs, data sources, and user objectives.
-

Real-Time Integration
Real-Time Integration
Connect with your CRM, ERP, marketing tools, and other platforms.
-

Data Storytelling Expertise
Data Storytelling Expertise
We don’t just visualize data—we build narratives that drive decisions.
-

Scalable Solutions
Scalable Solutions
Whether you’re a startup or an enterprise, our dashboards grow with your data.
-
Visual Design Excellence
Visual Design Excellence
Clean, interactive, and built with the end user in mind.
Our Process
-

Discovery & Goal Setting
We assess your business goals and data landscape. -
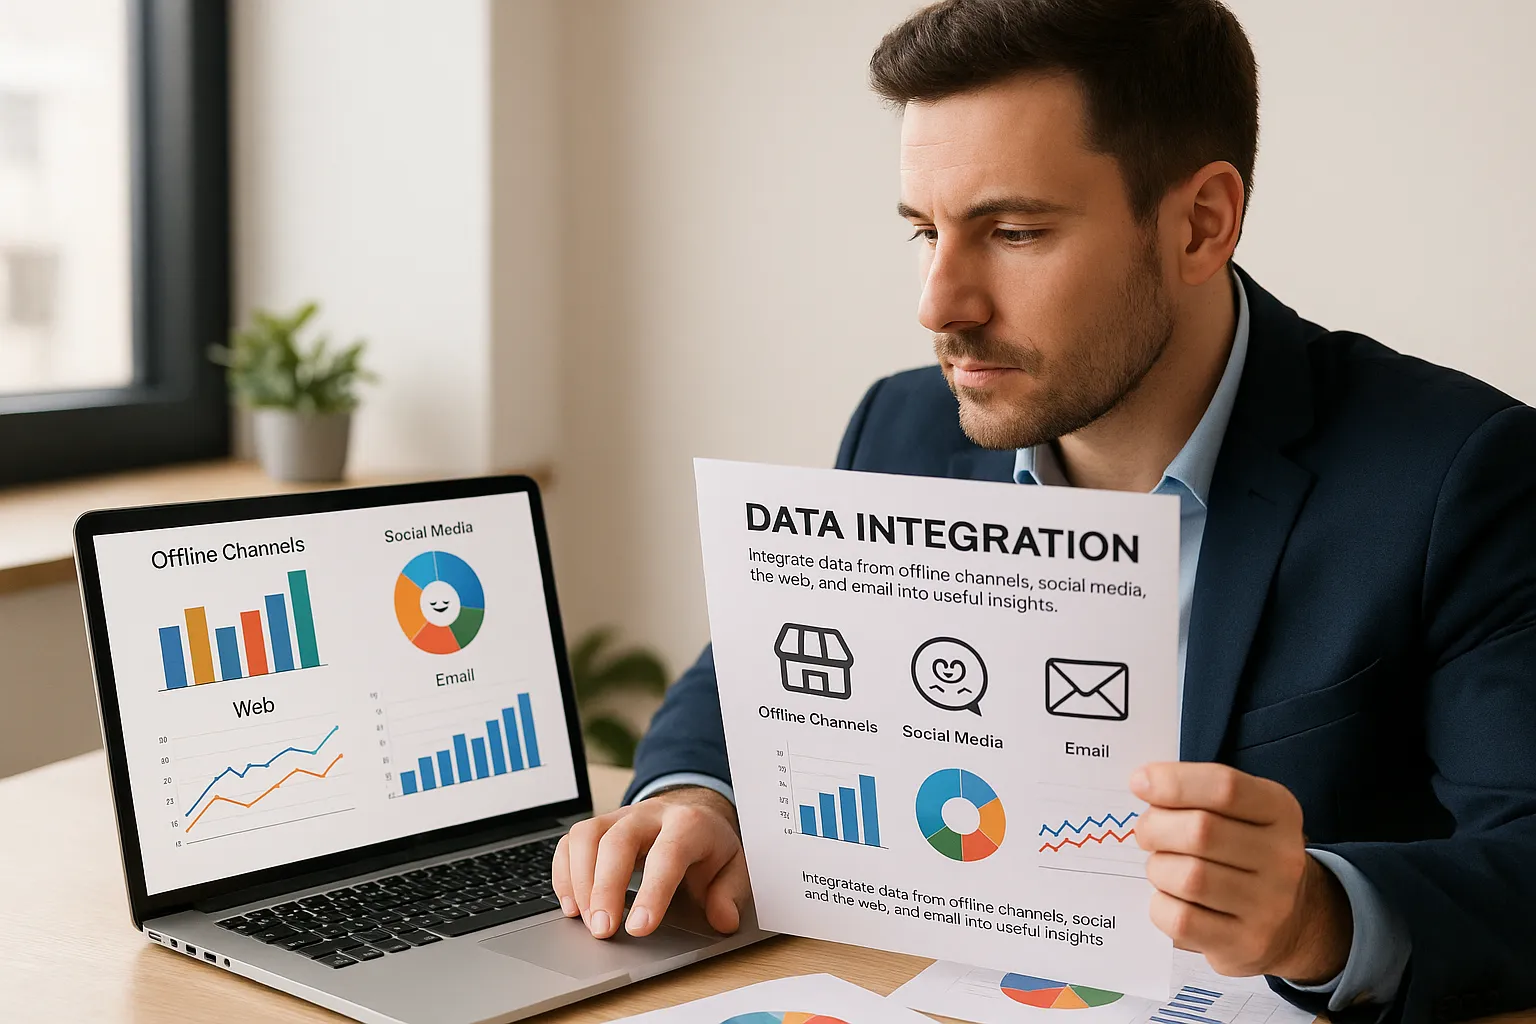
Data Integration
Seamlessly connects multiple sources for a unified view. -
Dashboard Design
Build responsive, intuitive dashboards tailored to decision-makers. -
Deployment & Support
Launch visual tools and train teams for ongoing use.
Who Can Benefit?
- Marketing and Sales Teams
- Operations and Supply Chain Managers
- C-Level Executives
- Healthcare Providers
- Financial Analysts
- Digital Agencies and Consultants