See the Big Picture. Take the Right Action.

Data Reporting and Visualization | Visualize Trends

At Express Analytics, we bring your data to life. Our Data Visualization and Reporting Services transform raw numbers into clear, interactive dashboards that help you uncover insights, align your teams, and take decisive action faster than ever before.

Schedule a Consultation
What Are Data Reporting and Visualization Services?
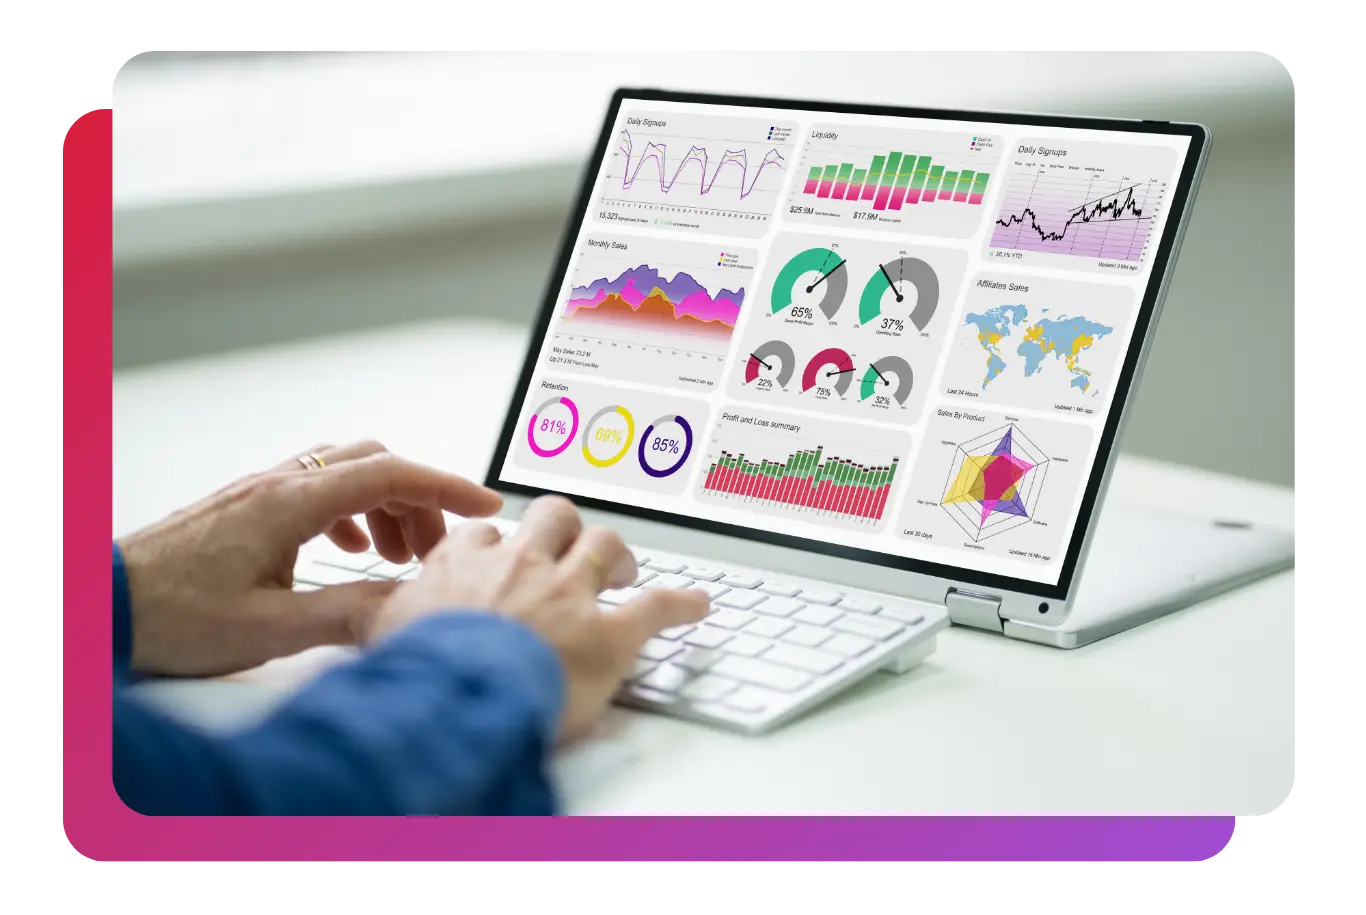
Data visualization involves presenting data through charts, graphs, and dashboards. Our Data Reporting and Visualization Services go beyond static reports; we offer dynamic views of your KPIs, trends, and outliers. Combining data analytics and visualization services, we help you connect the dots, spot opportunities, and act confidently.
Industry-Specific Visualization Applications
  • Retail & eCommerce

    Drive Smarter Sales

    Track inventory, monitor product trends, and optimize promotions with visuals that help improve ROI.

  • Financial Services

    Visualize Risk & Return

    Create powerful dashboards to monitor portfolios, flag anomalies, and assess fraud risk in real-time.

  • Healthcare

    Diagnose Data with Clarity

    In a HIPAA-compliant environment, visualize patient outcomes, hospital metrics, and resource utilization.

  • Marketing & Advertising

    Analyze Every Touchpoint

    From CTR to customer journeys, see your full funnel performance in one centralized dashboard.

Our Process
  • Goal Discovery

    We map your reporting needs and visualization use cases.

  • Data Connection

    Cleanly integrates data from multiple sources.

  • Dashboard Development

    Create intuitive, branded reports aligned with KPIs.

  • Training & Support

    Empower your team to own and use the insights daily.

Advanced Analytics and Visualisation
Why Choose Express Analytics?
  • End-to-End Data Visualization Consulting Services

    Strategy, design, deployment, and beyond.

  • Tailored Dashboards

    Created for your business goals, user roles, and KPIs.

  • Real-Time Data Sync

    Integrates with tools like CRMs, ERPs, marketing platforms, and more.

  • Expert Visual Storytelling

    Convey trends that matter with precision and impact.

  • Scalable & Secure

    From startups to enterprises, our systems adapt to your size and needs.

  • Designed for Impact

    Engaging, accessible, and decision-maker-friendly dashboards.

Express Analytics

Business Value & Benefits

Schedule a Consultation
Want to book an intro call? We can do that!
  • Data Simplification

    Turn complex metrics into clear visual stories.
  • Real-Time Visibility

    Make agile decisions with live reporting.
  • Improved Team Collaboration

    Align stakeholders with shared visual insights.
Fill up the contact form below to get in touch !
Don’t submit a contact form for guest posts. For guest post inquiries, please reach out to marketing@expressanalytics.net

Who Can Benefit?

  1. Marketing and Sales Teams
  2. Operations and Supply Chain Professionals
  3. Executives & Leadership Teams
  4. Healthcare & Insurance Providers
  5. Financial Analysts
  6. Agencies & Data Consultants
Recommended related ResourcesCheck out other resources from our Knowledge-base